Recently the independent culture research lab ZZZINC interviewed me for the Mosaic online magazine. It was a pleasure to answer Paco González‘ questions on our practice at Near Future Laboratory and our work on urban data. The result is now online: Entrevista a Fabien Girardin (English version).
Tag: urban computing
Ville Vivante
Over the last year we have been collaborating with the mobile phone operator Swisscom and the City of Geneva to materialize insights on urban centralities and the connectivity of central neighborhoods with peripheral towns. The fundamentals of this project rely on measures, maps and visualizations of the pulse of the city through the activity of its mobile phone networks.
In the desire to make this work more public and raise the public awareness on the use of network data as part of urban management strategies, the Mayor of Geneva proposed to embed the data into were they are generated. To produce this ‘urban demo’ we collaborated with our friends at the Lift Conference to create an event and delivered aggregated network activity measures to the digital magicians at Interactive Things. Their evocative visualizations named Ville Vivante took the form of a visual animation and eight posters deployed at the Geneva central station from February 20th to March 4th 2012.
The visual animation
The posters present in key areas of the train station
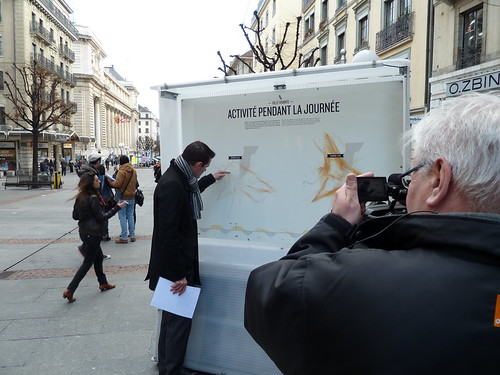
And Interactive Things co-founder Benjamin Wiederkehr presenting the project and their magic at the Lift Conference
Weekending 21012012
Fabien and Nicolas went to Madrid for a workshop at BBVA innovation about Smart Cities. Organized by Urbanscale (and more specifically by Jeff Kirsh, Adam Greenfield and Leah Meisterlin), it focused on opportunities to use networked data for the client. It basically followed up on the previous work we have done with this bank last year.
The workshop went well, with a combination of short talks, field observations (qualitative and quantitative) and discussions. This workshop was followed by an open session entitled “Beyond Smart Cities” at BBVA’s Innovation Center, with Adam Greenfield, myself (Nicolas) and Kevin Slavin. My slides are on Slideshare. There’s a write-up of the event at the following URL. As described by Kevin on his tumblog, “As surely as it feels like a movement has a name (“Smart Cities”) it also feels like the critique of said movement is collectively more articulate and persuasive. Now the key is to find language to describe what it should be, to go beyond popping the balloon and figuring out what the party really needs.“.
Here in Los Angeles Julian has been hard at work puzzling over an incredibly simple problem of making a little audio device called an Ear Freshener avoid having a power switch and a volume knob. He thinks the solution was intimated by a generous comment poster who told him to slap a couple of transistors in strategic locations in the circuit. So he tried that. It seems to make sense. Hopefully it won’t destroy everything.
Related to this were discussions about the principles behind/between things that make sound — such as sound should just come out of them, rather than be all fussy with settings, configurations and network connections. And that tied into an ongoing thinking thing about latter day considerations about “simplicity”, “one thing done well” and skinny Williamsburg/Brick Lane 23 year olds with full beards who’ve done nothing to deserve a full beard but rock Holgas and fetishize film/vinyl/casette tapes fixed-gear bikes and the like. Thus, we’ve been working on a short essay on the topic of the Cult of the Analog Cult. Or something like that.
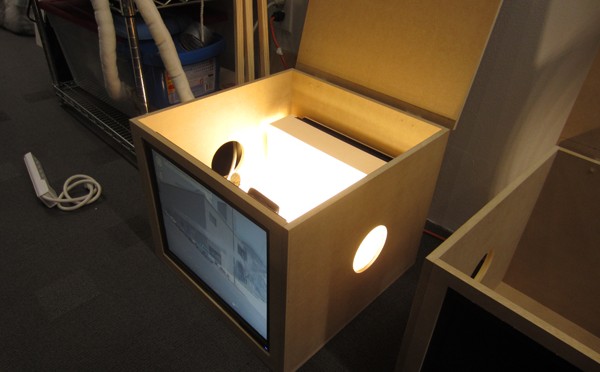
Meanwhile, on the East side of L.A. Jayne (with Kickstarter funding in hand) has been getting back to making new Portals. They’re still in the physical draft/sketch phase of things but making the upgrade from end-table-foam-core to mdf feels quite satisfying. The insides are still very rough and she’s still getting started with hooking up the magic/technology bits, but at least now a pair of Portal boxes exist in the world, ready to be filled with interactive goodies.
At the Smart City World Congress
This week was dedicated to the Smart City World Congress in Barcelona. It was my first outing in a comfy Near Future Laboratory jumpsuit. With Nicolas, we are indeed slowly shutting down the mainframes at Lift Lab and relocating our immaterialities to the Near Future Laboratory facilities. These things take their good share of time and energy, but we are pretty excited to merging our operations with a new gang of scouts dispersed hither and yon. The event collided with two other important milestones of projects steered these past few months.
First our client BBVA, presented publicly some of the measures and indicators of commercial activities in cities we have been producing and investigating. The visual supports of this project take the forms of maps (pdf), dashboards, and tools that each reveal a city and its quantified streets under new spatio-temporal lights.
Second, my peeps at Bestiario have working endlessly to release Quadrigram, a tool for individuals and organizations that work intensively with data and information. We are now running in private beta. More on that later.
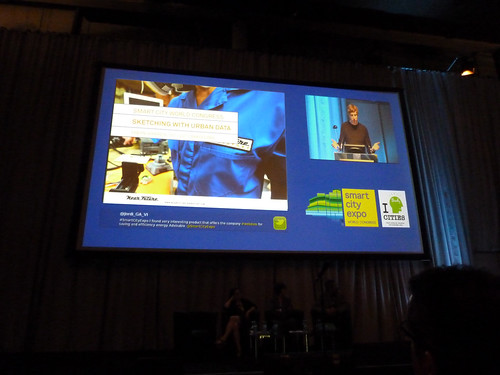
Captured preaching the word and proudly exposing a near future laboratory jumpsuit
So, in the margin of the multiple discussions on the definitions of a *smart* city, I could not help but contribute to the congress with my experience on the field in making urban data work. My discoursed focused on the necessity to treat data as a living material that must be crafted and manipulated at the different stages of knowledge and service production. I name that “sketching with data” and as with any creative work with digital technologies, it comes with tools and an undisciplinary process. Here are the slide deck + notes of my talk:
Sketching with urban data (PDF 6.9MB) presented at the Smart City World Congress in Barcelona on 29.11.2011.
In the audience, Alexandra Etel Rodriguez, Partner at Connected Brains produced visual notes of my talk. Thanks Alexandra for sharing this graphic recording!
Thanks to the organizers for the invitation!
Slide Deck of Lecture at ENSCI
Below are the slides of a lectures I gave a couple of weeks ago at the ENSCI (Ecole nationale supérieure de création industrielle) in Paris. The content (in French) is mainly directed to design students and practitioners intrigued about the new digital urban actors and the process to materialize layers of network data into information. I based my discourse on the recent investigations and experimentations we perform at Lift Lab (e.g. study of hyper-congestion, mobility, social navigation). Particularly, I highlighted the bestiary of practices, tools, languages and protocols that we articulate our approach with:
Un nouveau monde de données, ENSCI, May 18, 2001 (15.8MB)
The ENSCI offers a particularly compelling approach to its student by confronting them with concepts and practices at the frontiers of design. Thanks to David Bihanic and Licia Bottura for the invitation!
Introducing Elephant Path
It is rewarding to see some our areas of investigation at Lift Lab burgeoning in relation with our clients and partners. For instance, we now have a good set of tools and reasonably well-documented processes that help qualify and profile territories from their network activity (e.g. GSM, WiFi, Bluetooth, mobility infrastructures, social networks). One specificity of our approach is to produce visualizations that characterize the data at hand very early in the analysis process. It tremendously helps bring the different actors of a project on the same page by opening a dialogue and their interpretations of what they see is often great material for early insights to focus the investigation (see Exploration and engage in the discussion in the Data City essay).
This ability to sketch with data is particularly fruitful when dealing with multidisciplinarity. Indeed, data visualization brings together over a same language very diverse practices and methodologies (e.g. in our projects on network data, we deal with a bestiary of physicists, network engineers, marketing directors, salesmen, architects, geographers, social scientists, innovation specialists, …). Over the last months, we have been very fortunate to partner with our friends at Bestiario who share a common vision : data visualization is part of an innovation process not its outcome. They applied this perspective in their latest product Impure, an engine with an intuitive visual programming language. Impure has particularly revolutionized our ability to quickly communicate the early results our investigation. In a few weeks we have been able to swiftly create interfaces in collaboration with designers that did not have prior programming skill. One outcome of the use of our set of tools is Elephant Path, a concept by Lift Lab, designed and implemented by the young designer Olivier Plante in Impure :
Elephant Path, a social navigation interface based on he thousand of pieces of information inhabitants and visitors share publicly on the web
Our idea of Elephant Path germinated years ago with the emergence of new ways of reading and discovering a territory through its digital activities (see my PhD thesis). It collided with our long interest in the principles of social navigation (see rss4you developed by Nicolas and Robi in the early days of content syndication) that leverage traces of activities with the goal to facilitate locating and evaluating information. In the physical world, a classic example of social navigation is a trail (called elephant path, desire line, social trail or desire path) developed by erosion caused by people making their own shortcuts (a phenomenon we like to observe).
Taking that concept into the informational layers of our cities and regions, we sketched in Impure the possibility to reveal unofficial routes and beaten tracks through the thousand of pieces of information inhabitants and visitors share publicly on the web. Technically, we deployed our own algorithms to extract travel sequences using collections of user-generated content from Wikipedia, Flickr and Geonames. For each region, Elephant Path lists Wikipedia entries and selects some of the monuments, parks, and other popular sites with a story. It consolidates the the Wikipedia entries with geographical coordinates via the Geonames API. Then, it uses the Flickr API to collect the information photographers share at these locations. Finally is applies our own network data analysis algorithms to filter the data, produce travel sequences and measure photogenic levels.
We have done it for both Paris and Barcelona. For each city, Elephant Path provides measures on the main trails, on the photogenic attractions and the months of activity. For instance the information reveals that:
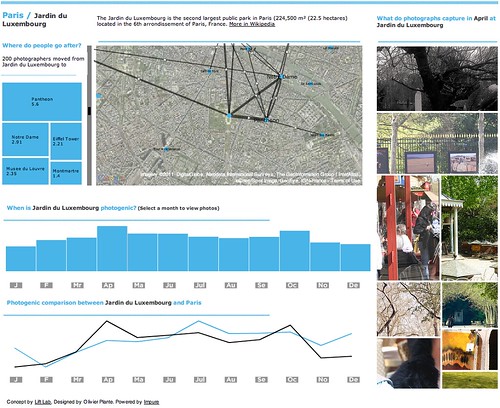
Paris seems to be a “summer” destination according to their monthly photographic activity. If you are in Paris during that period, the parks (Bois de Boulogne, Parc Monceau and Jardin du Luxembourg) might not be you visiting priorities. Indeed, these sites seem to be more photogenic in Spring and Fall. But if you are at Jardin du Luxembourg, there is some chances that you were in the St-Germain des Prés neighborhood (e.g. Café de Flore) previously and that your stroll there might very well bring you to Centre Pompidou that links the nearby Panthéon with the trendy Marais neighborhood. Barcelona seems to be more of “fall” destination according to the monthly photographic activity. Discover it yourself. [More screenshots]
An interface designed for you to copy and adapt it
But Elephant Path doesn’t end with data visualization, maps and graphs that can be embedded into web pages. It is meant to be open and be appropriated in unexpected ways. The Impure platform offers numerous data access, information processing and visualization capabilities. You can copy the code and data of Elephant Path and improve it in your workspace. Content of the work content is under the terms of a Creative Commons License. Do not hesitate in ripping and adapting it!
Networks, Sensor Networks, Human Sensors
While I was in Barcelona to attend the Barcelona Design Week, Josep Blat presented at the Foro de Movilidad de RedIRIS in Madrid the research themes and works developed with him as my PhD supervisor. RedIRIS provides highspeed Internet connectivity and other network facilities for the academia in Spain. On their invitation we shared some insights on the innovative exploitation of network data and their implications.
The presentation ran under the name “Networks, Sensor Networks, Human Sensors” (pdf).
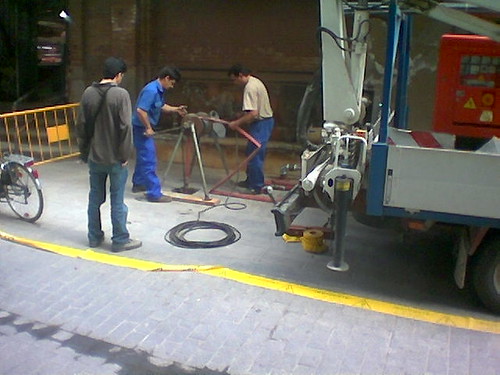
Wires and their exploitation under new scrutiny
Why do I blog this: Publics institutions that make a living transporting bits also become curious on extracting value from network data. Our presentation complemented very well a day that had started with a demonstration of the use of animal digital traces in the Doñana natural park in the South West of Spain.
Thanks to Gerard Alcorlo i Bofill for the invitation!
A synchronicity: Design Fictions for Asynchronous Urban Computing
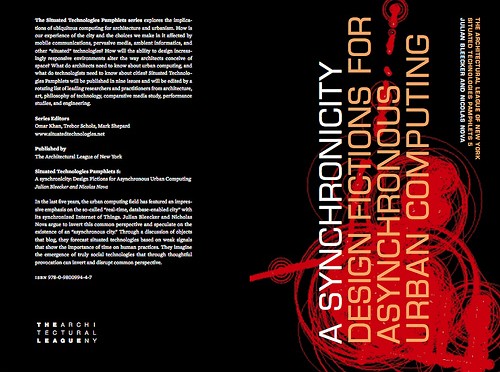
This just in: A Synchronicity: Design Fictions for Asynchronous Urban Computing — Nicolas Nova and myself conversing about what we’re calling asynchronous urban computing — has been released by the Architectural League of New York. It’s a dialogue on an inverted urban computation framework, with material embodiments of the peculiar designed artifacts we cooked up to help explicate our upside down worlds.

Here’s what the editors have to say:
In the last five years, the urban computing field has featured an impressive emphasis on the so-called “real-time, database-enabled city” with its synchronized Internet of Things. In Situated Technologies Pamphlets 5, Julian Bleecker and Nicholas Nova argue to invert this common perspective and speculate on the existence of an “asynchronous city.” Through a discussion of objects that blog, they forecast situated technologies based on weak signals that show the importance of time on human practices. They imagine the emergence of truly social technologies that through thoughtful provocation can invert and disrupt common perspective.
It’s available from Lulu, which means you can download it for free, or buy it for real and augment the reality of your book pile. I suggest buying it. We don’t get a penny, but the folks over at The Architectural League and the Situated Technologies genies need to keep doing the cool, curious things they do.
Thanks to the Situated Technologies editors, Omar Khan, Trebor Scholz and Mark Shepherd.
Urbanism, Data-Driven

(Some cartogram structures and linkages Pascal created as sensor maps where the geography is an implied and driven — rather than the driving — parameter.)
Fabien Girardin, MIT brainiac and a fellow Near Future Laboratory ‘naut presented his expert and insightful trinity of themes that appear to be the main motivators behind "urban computing", a bit of cocktail party conversation related to this short essay that Kazys Varnelis and Leah Meisterlin wrote, and that Nicolas poked a stick at.
Fabien describes three prime motivators behind the “urban computing” discussion and construction projects. Bears repeating, with some commentary.
1. Creating an opportunistic and optimistic urban environment that is somehow “better” than one without some sort of underlying computational infrastructure. This is the realm of the ubiquitous computing folks. The visions are aspirational — near-future signposts always already just out of reach and endlessly deferred — perhaps this is the definition of industry and academic R&D. Provide curious near-future fictions about possible near-future worlds. Effectively science-fiction expressed through objects and scenarios and large research (instead of film and television production) budgets. (Cf ““Resistance is Futile”: Reading Science Fiction Alongside
Ubiquitous Computing”, Paul Dourish and Genevieve Bell, forthcoming in Personal and Ubiquitous Computing.)2. Study of the impacts and implications of computational systems and operations in an urban context, performed by GIS folk and urban planners and computer science people. These are studies of the dynamics of data-people sensed in the city, mapped and used to develop insights on urban conditions, or perhaps used as contributing information for design or re-design of urban geography. In some cases the data is interpreted in real-time, such as you might expect to be done to manage loads on cellular data networks, etc.
3. The action, postulating and creative exercises of independent and undisciplinary explorers and adventurers who shuffle and interleave the interesting data points that are anchored to geographies that can be re-mapped. This has brought us such interesting tidbits as the various crime data maps, for example, or the flows of automobiles throughout cities. (Using the geeky, horribly, self-deprecatingly named “mash-ups”.) What is happening here that is most compelling to me at least is that “GIS” activities are becoming something that anyone, without a license or professional sanction can do, inexpensively (i.e. for free and a bit of time). So, anything new here and worth glorifying is this fact — we can be our own map-makers. This is significant in the Foucauldian power-knowledge sense of significant. Cartograms such as the fundraising maps, which started out as a very DIY project, are important because they create new meaning and possibilities for action, or shifts in perspective that can lead to change, rather than stagnation. (There’s a normative element, of course. Visualizations of data with geographies, in the power-knowledge realm of things, are as free to interpretation as anything that alleges to be fact, so they can’t be counted upon to prove much of anything. At worst, they can be enrolled in larger conversations, just like any good knowledge agent.)
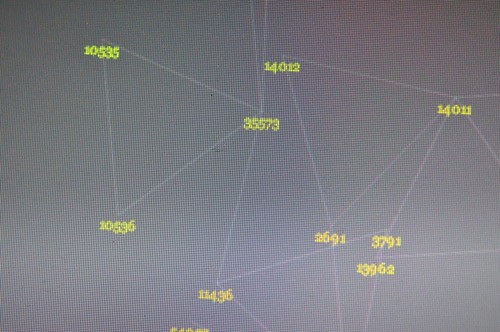
(Some more of Pascal’s cartogram structures and linkages. Sensor maps recorded amongst a small group of us and visualized such that the geography is an implied and driven — rather than the driving — parameter.)
I’d add a bit here. How can the experience of space — urban space, just to stick to the most discussed idiom — become fruitfully and playfully data-driven? Mapping data onto geographies by their instrumentalized location in space is okay. It’s a bit knee-jerk, though. What I mean is that re-mapping data with an entirely different basis could possibly produce an entirely different urban experience that may, at worst, be curious and playful. Just to see what comes of this. The Laboratory has been working for way too long on such re-mappings that do not assume that latitude and longitude are the canonical reference points for whatever data gets built on top.
I know..I know. This is weird. And the first project I was involved with that did this — an edition of PDPal that created maps based exclusively on interpreting an “experience” — fought a losing battle. But there are some indicators that this approach is at least worth exploring.
Creating “maps” that have a spatial aspect to them, but that do not use space as the primary or explicit reference datum can then emphasize people-practices or experiences first, with the geographic datum implicit or made into a driven, rather than driving, parameter. Paulos and Goodman’s “Jabberwocky” project comes to mind, as do Twitchr and other mappings of “encounters” and actions that are not expecting to use GPS first-and-foremost.
Situationist Space (Thomas F. McDonough)
Here in the Laboratory we’ve been building several prototype devices that record Bluetooth encounters for later visualization. The first prototype was a small Python script running on a Nokia N70 phone. It was like a little data attractor that would sniff for Bluetooth devices, and then record them in a log file, and send them to a server to be persisted in a database.
Two recent editions used a small, custom-designed device that used the Bluetooth scanning mode of a radio to essentially do the same thing, storing the results in a Flash memory device to be later extracted with a simple USB interface. Lately a bunch of us in the studio have been working with a similar concept in the form of a background sensing application developed at Nokia R&D for S60 devices that does all of this, plus quite a bit more. (Currently in closed alpha, but soon to be available publicly.) The biggest challenge (besides running it on an S60 device..) is making meaning out of all of this. The strongest vectors for me, at least, lead to re-mapping and exploring possibilities playfully, with no specific expectations that there is intelligence in the maps by themselves.
# install first the following files to your phone
# (they will install automatically the needed libraries for the script below):
# aosocket-series60_v20.sis, pdis.sis
# found at: http://pdis.hiit.fi/pdis/download/pdis/

# this script was found from forum.nokia.com

import e32
import appuifw
##import aosocketnativenew
from pdis.lib.logging import *
##import httplib, urllib
from location import gsm_location
import time
import sysinfo
import select

cell = []
init_logging(FileLogger("e:\apache\htdocs\bt_probing.html"))

def tell(string):
    #logwrite(string)
    if e32.is_ui_thread():
        print string
        e32.ao_yield()

# ----------------------------------
from aosocket.symbian.bt_device_discoverer import *
#from socket import * # for obex file send

def discovered(error, devices, cb_param):
    if error == 0:
        global cell
        #tell("start discovery..")
        cell = gsm_location()

        #tell("devices: " + str(devices))
        tell(cell)
        #print location.gsm_location()
        for address, name in devices:
            logwrite("")

            tell(cell[0])
            tell(cell[1])
            tell(cell[2])
            tell(cell[3])
            print location.gsm_location()
            urllib.urlopen("http://smalltown.nearfuturelaboratory.com/upload_bt.jsp",
                           urllib.urlencode([('addr',address),('name',name),
                                             ('imei', sysinfo.imei()),
                                             ('batt', sysinfo.battery()),
                                             ('signal', sysinfo.signal()),
                                             ('cell_0', cell[0]), ('cell_1', cell[1]),
                                             ('cell_2', cell[2]), ('cell_3', cell[3])]))
    else:
        tell("device discovery failure: error %d" % error)
    _discoverer.close()


# -----------------------------------------------------------------------------


while(1):
    try:
        _discoverer = BtDeviceLister()
        _discoverer.discover_all(discovered, None)
        #tell("discovering")
        e32.ao_sleep(15)
        print "scanning again"
    except:
        tell("init failure")
        appuifw.note(u"Fatal error.", "error")
Nicolas Nova on Urban Computing
Nicolas Nova On Urban Computing from Julian Bleecker on Vimeo.
Nicolas was interviewed by Infonomía. The interview was written up in Spanish, but there is also this English language video that has Nicolas’ remarks on Urban Computing. Urban Computing, as Nicolas sees it is really a kind of enhancement to what we all do anyway in urban contexts. The most interesting aspects of this, as with anything, even if its technological, are the “art” projects — the ones that instigate and provocate, creating puzzling and curious representations of urban spaces, which do not only include geographic spaces, the ones we are most familiar with, but maps of other kinds of experiences, like the movement of mobile communications clouds where cellphone use migrates over time, or representations of data flows through internet usage over the course of a day, or activity at magnetic and RFID card swipe terminals.
These issues become increasingly significant in an era when more and more people — most people, in fact — live in urban contexts. These are often people in dire, barely habitable conditions. Urban computing cannot be just the fancy, high cost, newest gadgets combining a $700 mobile gps phone television linking device. We also need to think about things that cost next to nothing, but have a high value in terms of their capacity to support and perhaps even bolster the conditions of less affluent populations who are increasingly the majority inhabitants of cities.
Nicolas’ own remarks are here.
A couple of related things that recently popped up. Fabien has some good remarks on a book by Phil Hubbard called “The City (Key Ideas in Geography)”, about the relationships amongst technology, city and the embedded histories of infrastructures — not just the “new” infrastructures, but things like sewage, gas and water, for example.
Nat Torkington has a bit on some of the approaches to creating new ubiquitous computing ideas — quite related in context to urban computing insofar as urban contexts almost always implicate ubiquitous (everywhere, all the time) contexts.

